Well, the time has finally arrived. Some of you have been asking for an update on my solar panel system, and I’ve finally passed the one year mark. It was actually back at the beginning of October, so I’m a little late, but better late than never. Let’s take a look at how much energy my system has produced, how much I’ve saved, and if it met the estimate my solar installer predicted.
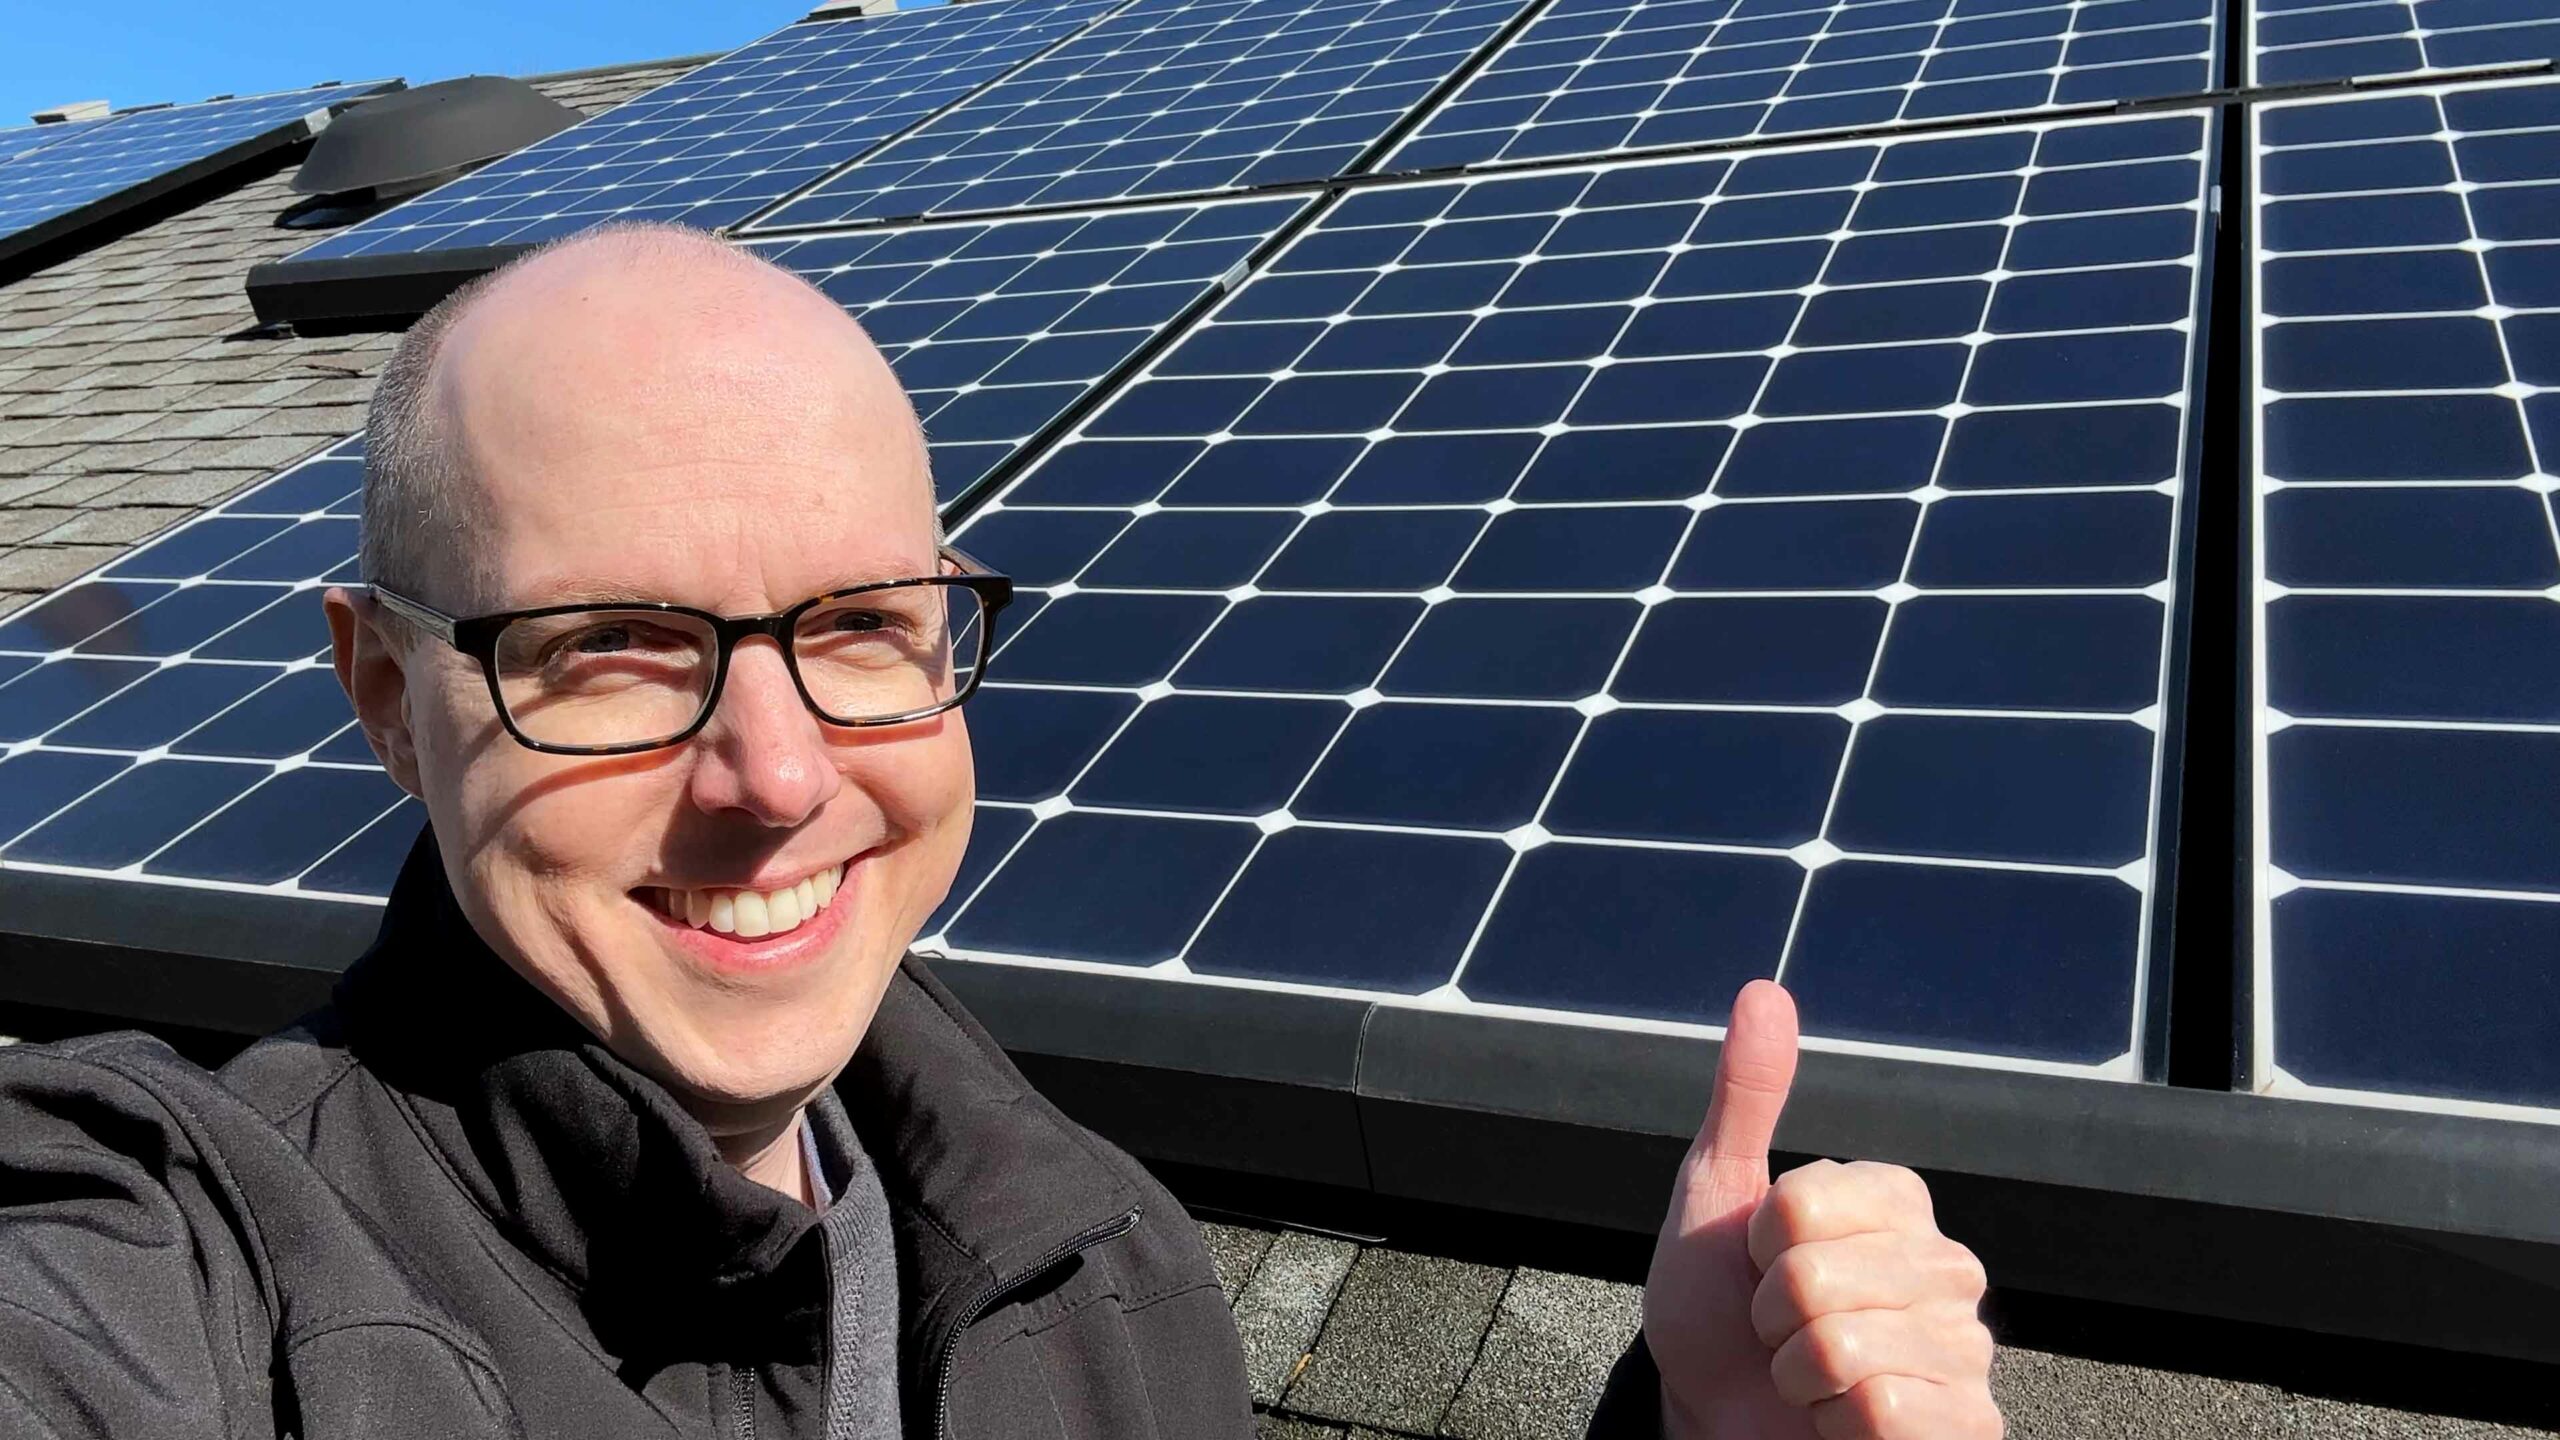
So if you haven’t seen my previous videos on my solar installation, you can find them here and here. But to give a quick summary, I live in the Boston area and have been documenting what it’s been like living with a 9.49 kW solar panel system in a colder climate. My house has a few challenges. If you live in the northern hemisphere, it’s best to have a southern facing roof to maximize your solar production, but my house is oriented more east-to-west. That’s why I have panels on both sides of my roof. The second issue is that my roof is relatively small. And finally, I have a fair amount of trees on the western side of my house that start to block the sun in the mid-to-late afternoon. Even with all of those challenges, the more efficient panels available today are still able to provide me a significant portion of the power I use over the year.

Before I jump into some of the year-end results, one important factor that gets brought up a lot on my solar panel videos is the high energy use some of you see in my numbers. I do use a lot of power, but it falls right in line with the national average. Getting solar panels helps to address the power generation side of the equation, but the other half is reducing the amount of power you use. I just published a video on that topic last week, so be sure to check that out if you’re interested to see some of the things I’ve been doing to address that.
Energy production over the year
So we had our solar panels turned on on October 4th, 2018. All of the numbers and data I’m going to share stretch between that date and October 3rd, 2019. Over the course of the year we had two short periods where our system went down due to a faulty shut off switch: once in January and the other in April. All in we lost 8 days of production, so not too bad. Ever since the switch was replaced the system has been rock solid.
The production amount across the entire year played out exactly like we expected. There’s a sine wave looking pattern that emerges, with the lowest production happening in the dead of winter in December, and the most production happening in July during the summer. What I found most interesting was that we saw a pretty quick spike in production in March, and a pretty dramatic drop in October. It wasn’t as gradual as I was expecting.
I use a Sense energy monitor on my home, so I can closely track our energy use in addition to our solar production. We average around 875 kWh each month, so if we layer on our usage line on top of our production line, you can see we’re not meeting our full needs. This was known going in. Our goal was to offset as much energy as we could with our solar production … given our home’s specific challenges. And in that regard we succeeded with about a 54% reduction in our grid electricity use.
Our solar installer offered a 10 year production guarantee with yearly estimates. If our production doesn’t hit the 95% mark of those estimates, they’ll pay out the difference. All in we’ve seen 6,688 kWh produced in the first year, which comes in just above their 95% estimate or 6,615 kWh. We actually hit 96.4% of the best case scenario, which is higher than I was expecting. In fact, in my 9-month update, I thought we’d fall just a little short of the installer estimate, so I’m glad to be wrong with that prediction.
For the days we missed because of the technical issue, I averaged out the 4 days before and 4 days after each outage to try and estimate what we might have seen during those days. In January, we were averaging 5.3 kWh/day, so probably missed out on 21.2 kWh. And in April, we were averaging 19.3 kWh/day, so missed out on 77.2 kWh. As disappointing at that is, it’s probably about $25 of electricity we lost out on during that period. If I add those missing Watts back into the grand total, we probably should have seen something like 6,786 kWh for the year, or about 97.8% of the best case scenario.
Costs
I’ve stated this before, but my goal has been to reduce my reliance on the grid as much as I can, and to do so in a financially responsible way that works for us.
So where did we land financially this past year? Well, my wife and I are pretty happy. We used to average $212 a month for our electric bill and now we’re averaging $97.80 a month … and that’s also with adding an EV to the mix. If you look at this graph that shows the year before solar compared to the year on solar, you can see exactly how much our electric bills have shifted. Obviously, it follows the same sine wave trend as the solar production, so there’s a big drop in our bill right around June and July. You can see that in June we actually had a negative balance on our electric bill. I’m not exaggerating when I say that my wife stood in the living room laughing out loud when she showed me the bill.
Year over year, we saved $1,489.86. Right in line with the $1,500 estimate I was projecting in my last video update. In Massachusetts we have full net metering, which means any overproduction we put into the grid gets fully wiped off of our kWh used. In essence the grid acts like a battery for us for production and cost-wise. That might not be the case where you live.
So how does all of this work out with the cost of the system as a whole? I’ve gone into great detail on this in previous videos, so I won’t recap all of the details here, but it worked out like we hoped. Our system cost a total of $29,609, which has 25 year warranties on the panels and micro-inverters, as well as a 10 year warranty on the workmanship and production from the installer. The Federal solar tax credit allowed us to recoup $8,883 of the cost.
And not to go off on a tangent, but I get a lot of comments about my “neighbors paying for my solar panels” … that’s not how the tax credits work. It’s a credit on your tax burden for the year that you claim it and isn’t that different from being able to claim your children as dependents in order to increase your tax deductions. The money you get back comes in the form of a tax refund because you’ve overpaid taxes for that year. Depending on your situation, you aren’t guaranteed to get the full 30% back in cash.
In any case, our final cost works out to $20,726, which we have in a 10 year solar loan. We’ve been working on paying that off as quickly as we can, and have actually paid it down by half already, so our interest on the loan should work out to be pretty low when all is said and done. Aside from a recent big lump sum we sent, we’ve been paying $200/month on the loan. We also receive SRECs for the amount of solar we produce, which amounts to $126.22 a month for a total of 10 years. In case you don’t know what SRECs are, they’re solar renewable energy credits that are paid out by the electric companies. Electric companies are required to achieve a certain amount of renewable energy in their grid system, so SRECs are an incentive to increase the number of people contributing to that renewable goal. Not every state has an SREC market, and the value varies region to region.
When you average out our monthly electric bill savings, we’re saving $114.20 a month. Add together the SREC and electric bill savings and you get $240.42, which means we’re coming out a whopping $40.42 ahead each month right now. (Yes, my wife is planning to retire early on these savings.) I know solar detractors may point to that as proof that this wasn’t worth it, but if you look long term, those numbers change quite a bit. It’s only $40 right now because we’re still paying off our loan at $200 a month. But at the rate we’re paying this off, we’re hoping to have the loan gone within a couple of years.
The $1,500 per year electric bill savings will work out to $15,000 in savings in the first 10 years alone. And that’s assuming that electricity prices won’t increase, which they will. They’ve increased 15% over the past 10 years, which is about $0.02 per kWh per year.1 But that varies depending on the region. Even without SRECs, we’d achieve breakeven on the solar panels in 13-14 years. But with SRECs we’re looking at a payback period much shorter than that. The SRECs and electric bill savings over 10 years work out to $30,146, which means a breakeven in just under 7 years. However, we have the interest on the solar loan to contend with. But as I mentioned before, we’re paying it off much faster than the 10 year loan, so the total interest should be a couple thousand dollars. We’re on track to breakeven in a little over 8 years at this point, which is right in the ballpark of what we were expecting before we got the panels installed.
And this is on a system with a 25-year warranty, which should be able to last well beyond that. Yes, there might be maintenance costs here and there down the line. And yes, if I have to replace my roof, it may cost a few thousand dollars to have a solar installer remove and replace the panels for me. But just looking at the total savings in electricity from year 10 – 25, once the SRECs are gone, we’re still talking about $20,000 – $25,000 in electricity savings … if not more. Everything from year 9 onwards should be pure profit for us, so having to spend a little money here or there to maintain or replace our roof is a drop in the bucket overall.
And this isn’t even counting the positive impact solar panels have on your home’s value. If you finance and pay for the system yourself and don’t lease it, adding solar to your home actually increases your home’s value by 3-4%.2 You’ll often see about $4 per watt of the installed solar panel system added to your home’s value. While I’m not counting on that for my system, it’s nice to know that I should be seeing a sizable increase on my home’s value on top of the electricity savings.
Final thoughts
I’ve stated it on previous videos, but my goal was to get as much energy as I can from a renewable and sustainable resource, and do it in a manner financially that worked for us. And on that goal we’ve succeeded so far. Right now there’s only a small savings month-to-month, but as soon as the panels hit breakeven the system turns into a profit maker each and every month going forward. It also doesn’t hurt that my car is mostly charged with sunlight.
If you’re interested in going solar, I strongly recommend checking out Energysage for research and articles. It’s a completely free service that has great write-ups and reviews of different solar panels, inverters, and solar tech that can be useful no matter where you live. But if you live in the U.S. and are interested in going solar, you can get quotes from installers by using my Energysage portal. You can plug in your information and request quotes from solar installers, which all get funneled into your EnergySage account. You don’t have to worry about getting flooded with phone calls. It makes it easy to compare installers, cost estimates and energy production quotes in one place. And installers also have customer rankings and feedback, so you can find a reputable and good quality installer. I’ve used it myself, that’s how I found my installer, so I can vouch for how well it helped me through the process.
1: http://news.energysage.com/residential-electricity-prices-going-up-or-down/
2: http://www.energysage.com/solar/why-go-solar/increased-property-values/


Comments